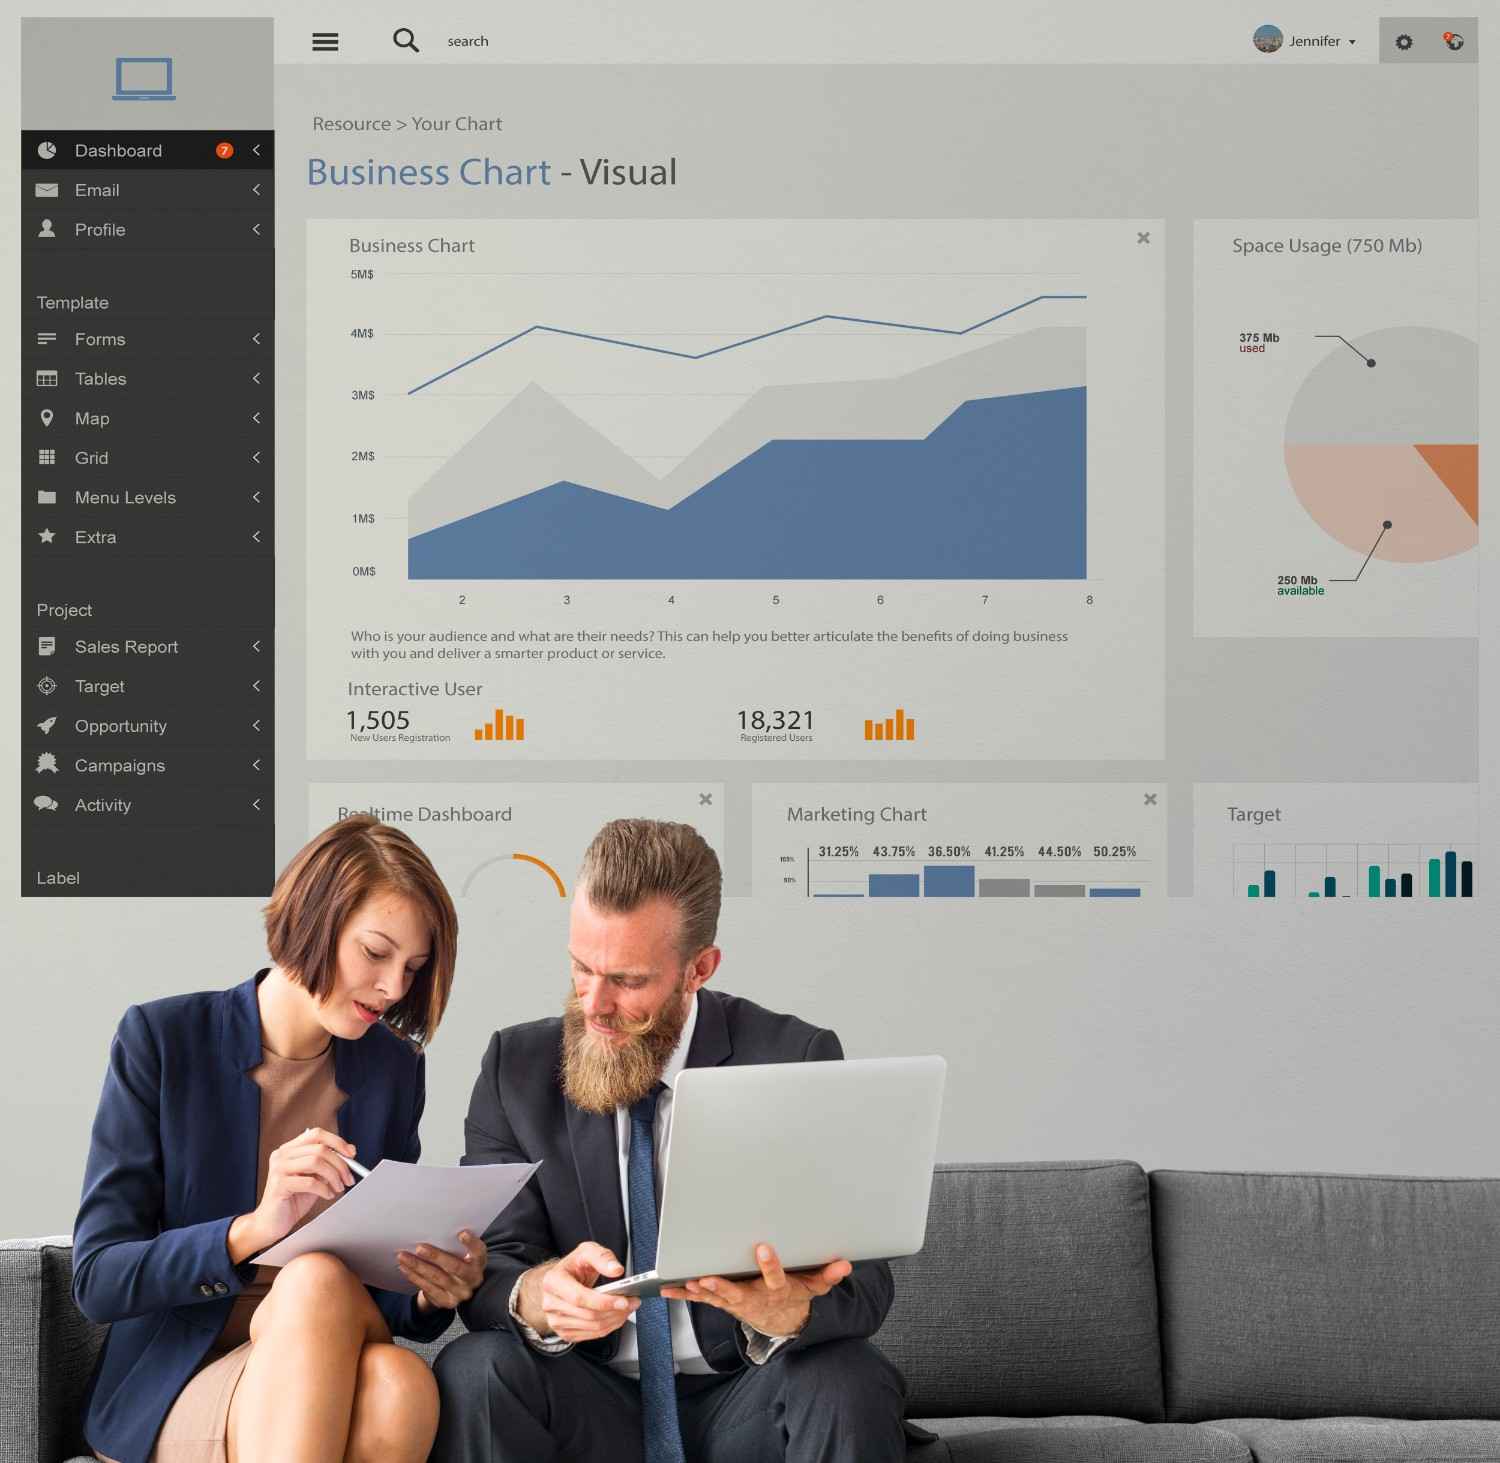

Turn complex business data into actionable insights with advanced analytics dashboards. Our solutions allow organizations to monitor KPIs, visualize trends, and track performance in real-time. These dashboards are designed for clarity, interactivity, and scalability, helping teams make informed decisions faster. By centralizing data from multiple sources, businesses can optimize operations, improve efficiency, and identify growth opportunities quickly. Empower your team with easy-to-use dashboards that highlight what matters most.
We assess your data sources, business goals, and reporting needs to design dashboards that provide clarity and actionable insights. Each dashboard is optimized for usability, ensuring key metrics are visible, accurate, and actionable for stakeholders.
Collect → Analyze → Visualize → Optimize. Our dashboards provide intuitive visualizations that transform data into actionable insights.
Aggregate data from multiple sources
Identify trends, patterns, and anomalies
Create interactive charts, graphs, and reports
Use insights to improve decision-making and performance

Turn complex data into clear insights
Monitor KPIs and performance live
Make decisions backed by reliable data
Tailor dashboards to your business needs
Identify opportunities and improve results
A dashboard packed with every available metric usually communicates less than one built around a few that matter.
Cramming in every possible data point buries the few numbers that actually drive decisions.
A single generic view rarely serves sales, marketing, and leadership equally well. Each needs its own lens.
A dashboard is only as trustworthy as the data feeding it. Inconsistent source data undermines every decision built on it.
As business priorities shift, dashboards built years ago can keep tracking metrics that no longer matter.
Website analytics, CRM data, ad platforms, sales figures, and other business systems can all be centralized.
Yes, where the underlying data sources support it, so teams see current performance rather than a stale snapshot.
Yes. Dashboards can be role-specific, so a sales lead sees pipeline metrics while marketing sees campaign performance.
We start from your specific business goals and work backward to the metrics that actually indicate progress toward them.
Whether you're planning a campaign, launching a brand, or needing expert advice, we’re here to help.